Where delivery loses its predictability
Numerous software organisations ask versions of these four questions
Will we hit the date?
The board asks. The customer asks. The sales team asks. You answer with your gut. Engineering reality is somewhere else, and you find out at the next retrospective.
How much we can commit?
Teams over-commit. Capacity is "vibes." Working harder isn't shipping faster, and you can't tell whether team performance is improving or just feeling that way.
Can we trust our sources?
Reports exist. Insights are produced. But the org doesn't act on them. Forecasts are made in spreadsheets, monthly, by someone — and nobody trusts them.
Are we performing better?
Lorem ipsum dolor sit amet, consectetur adipiscing elit. Ut elit tellus, luctus nec ullamcorper mattis, pulvinar dapibus leo.
These aren't process problems. They're measurement problems. And measurement problems are solvable.
our approach
Predictable delivery rests on two pillars. We engineer both
Most organisations have one or the other. They have data, but they can't trust it. Or they have dashboards, but the org doesn't act on them. Agile Delivery Intelligence is the practice of engineering both halves so they work together
Trustworthy data
Engineered requirements, clean Jira foundation, and multi-level actionable analytics — so the numbers you look at are numbers you can defend in a board meeting. Layers 1–3 of the Framework below.
Actionable decisions
ML-based forecasting and scenario simulation, integrated into the planning cycle — so the data becomes decisions you act on, weeks before the deadline. Layers 4–5 of the Framework below.
Both halves. Installed in your stack. Owned by your team.
THE FRAMEWORK
Agile Delivery Intelligence — five layers you will own
Demand & Requirements Engineering
The work that ensures everything downstream operates on a clean, well-structured input rather than a noisy backlog.
Clean data foundation
The plumbing work that makes Jira or other operational system a reliable source of truth — without which dashboards lie and forecasts mislead.
Multi-level Analytics & Insights
Delivery made legible to the business — at team, program, and portfolio levels.
Forecasting & Scenario Simulation
ML-based and probabilistic forecasting, plus the ability to answer “what if?” before the decision is made.
Operationalised Decision-Making
Insights integrated into the planning rhythm — so Jira becomes the system of decision, not merely the system of record.
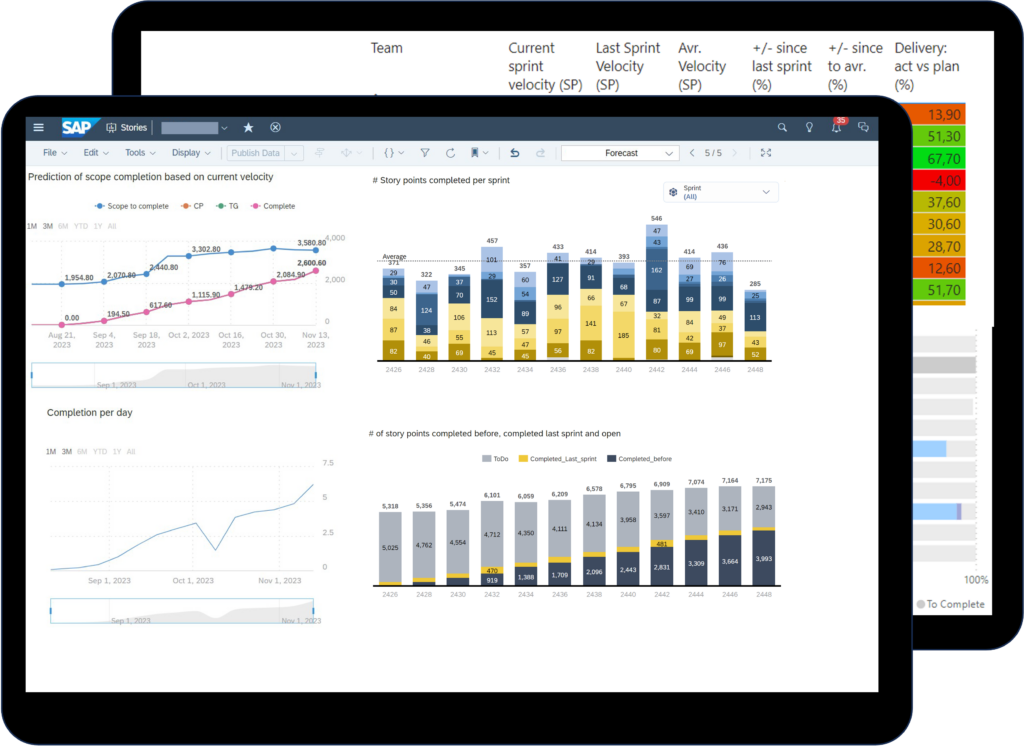
Delivery intelligence models for data-driven decisions
HOW WE WORK
ENGAGEMENT MODEL
Each phase installs one or more layers of the Framework. Part-time engagements are accepted; the four-phase logic remains the same
Goal settings & discovery (1-3w)
We start by understanding your current setup, processes, Jira hygiene, requirement quality, and the decision-making gaps that hurt most.
- Audit of current setup, processes, tools
- Align on business goals, priorities & target outcomes
- Define metrics, measurement points, planning horizons
- Identify data sources & gaps
- Plan the layer installation sequence
Output: A one-page measurement charter you agree to
Foundation & Analytics (2-4w)
We engineer the requirements layer, clean and structure Jira, and stand up multi-level analytics across team, program, and portfolio
- Demand & requirements engineering setup
- Jira foundation — workflows, fields, governance
- Multi-level dashboards (Power BI, SAP SAC, Tableau, jira, etc.)
- Reports, scorecards, and executive views
- ntegration into your existing BI tooling
Output: A live, trusted measurement layer running on engineered requirements.
Forecasts & Simulation (3-6w)
We add the ML-based forecasting and scenario simulation that turn the measurement layer into a forecasting system.
- Data cleanup and validation
- Selection and training of forecast models
- Multi-horizon Capacity Simulation Model
- Scenario simulation for "what if?" planning
- Data driven capacity & scope planning
Output: Working forecasts and scenario simulations, ready for planning use.
Enable & improve (ad-hoc)
We integrate forecasts and insights into your planning rhythm, train your team to run the system, hand over ownership & improve on demand.
- Integrate insights into PI planning, refinement, prioritisation
- Train teams and stakeholders to run the system
- Enablement & change management
- Monitor and improve continuously
- Measure impact & value
Output: Jira operating as a decision-making system. Your team owns it.
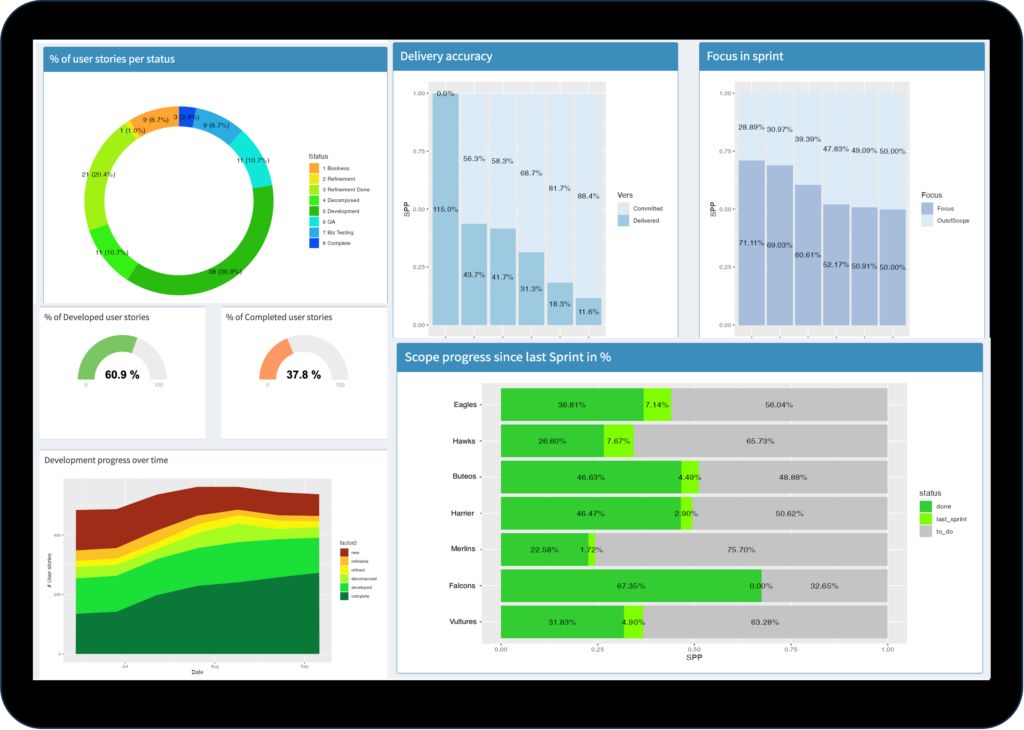
WHAT THE FRAMEWORK PRODUCES
Tangible outcomes from recent engagements
Numbers below are from recent engagements at large & midsize companies.
frameworks we support