
 |
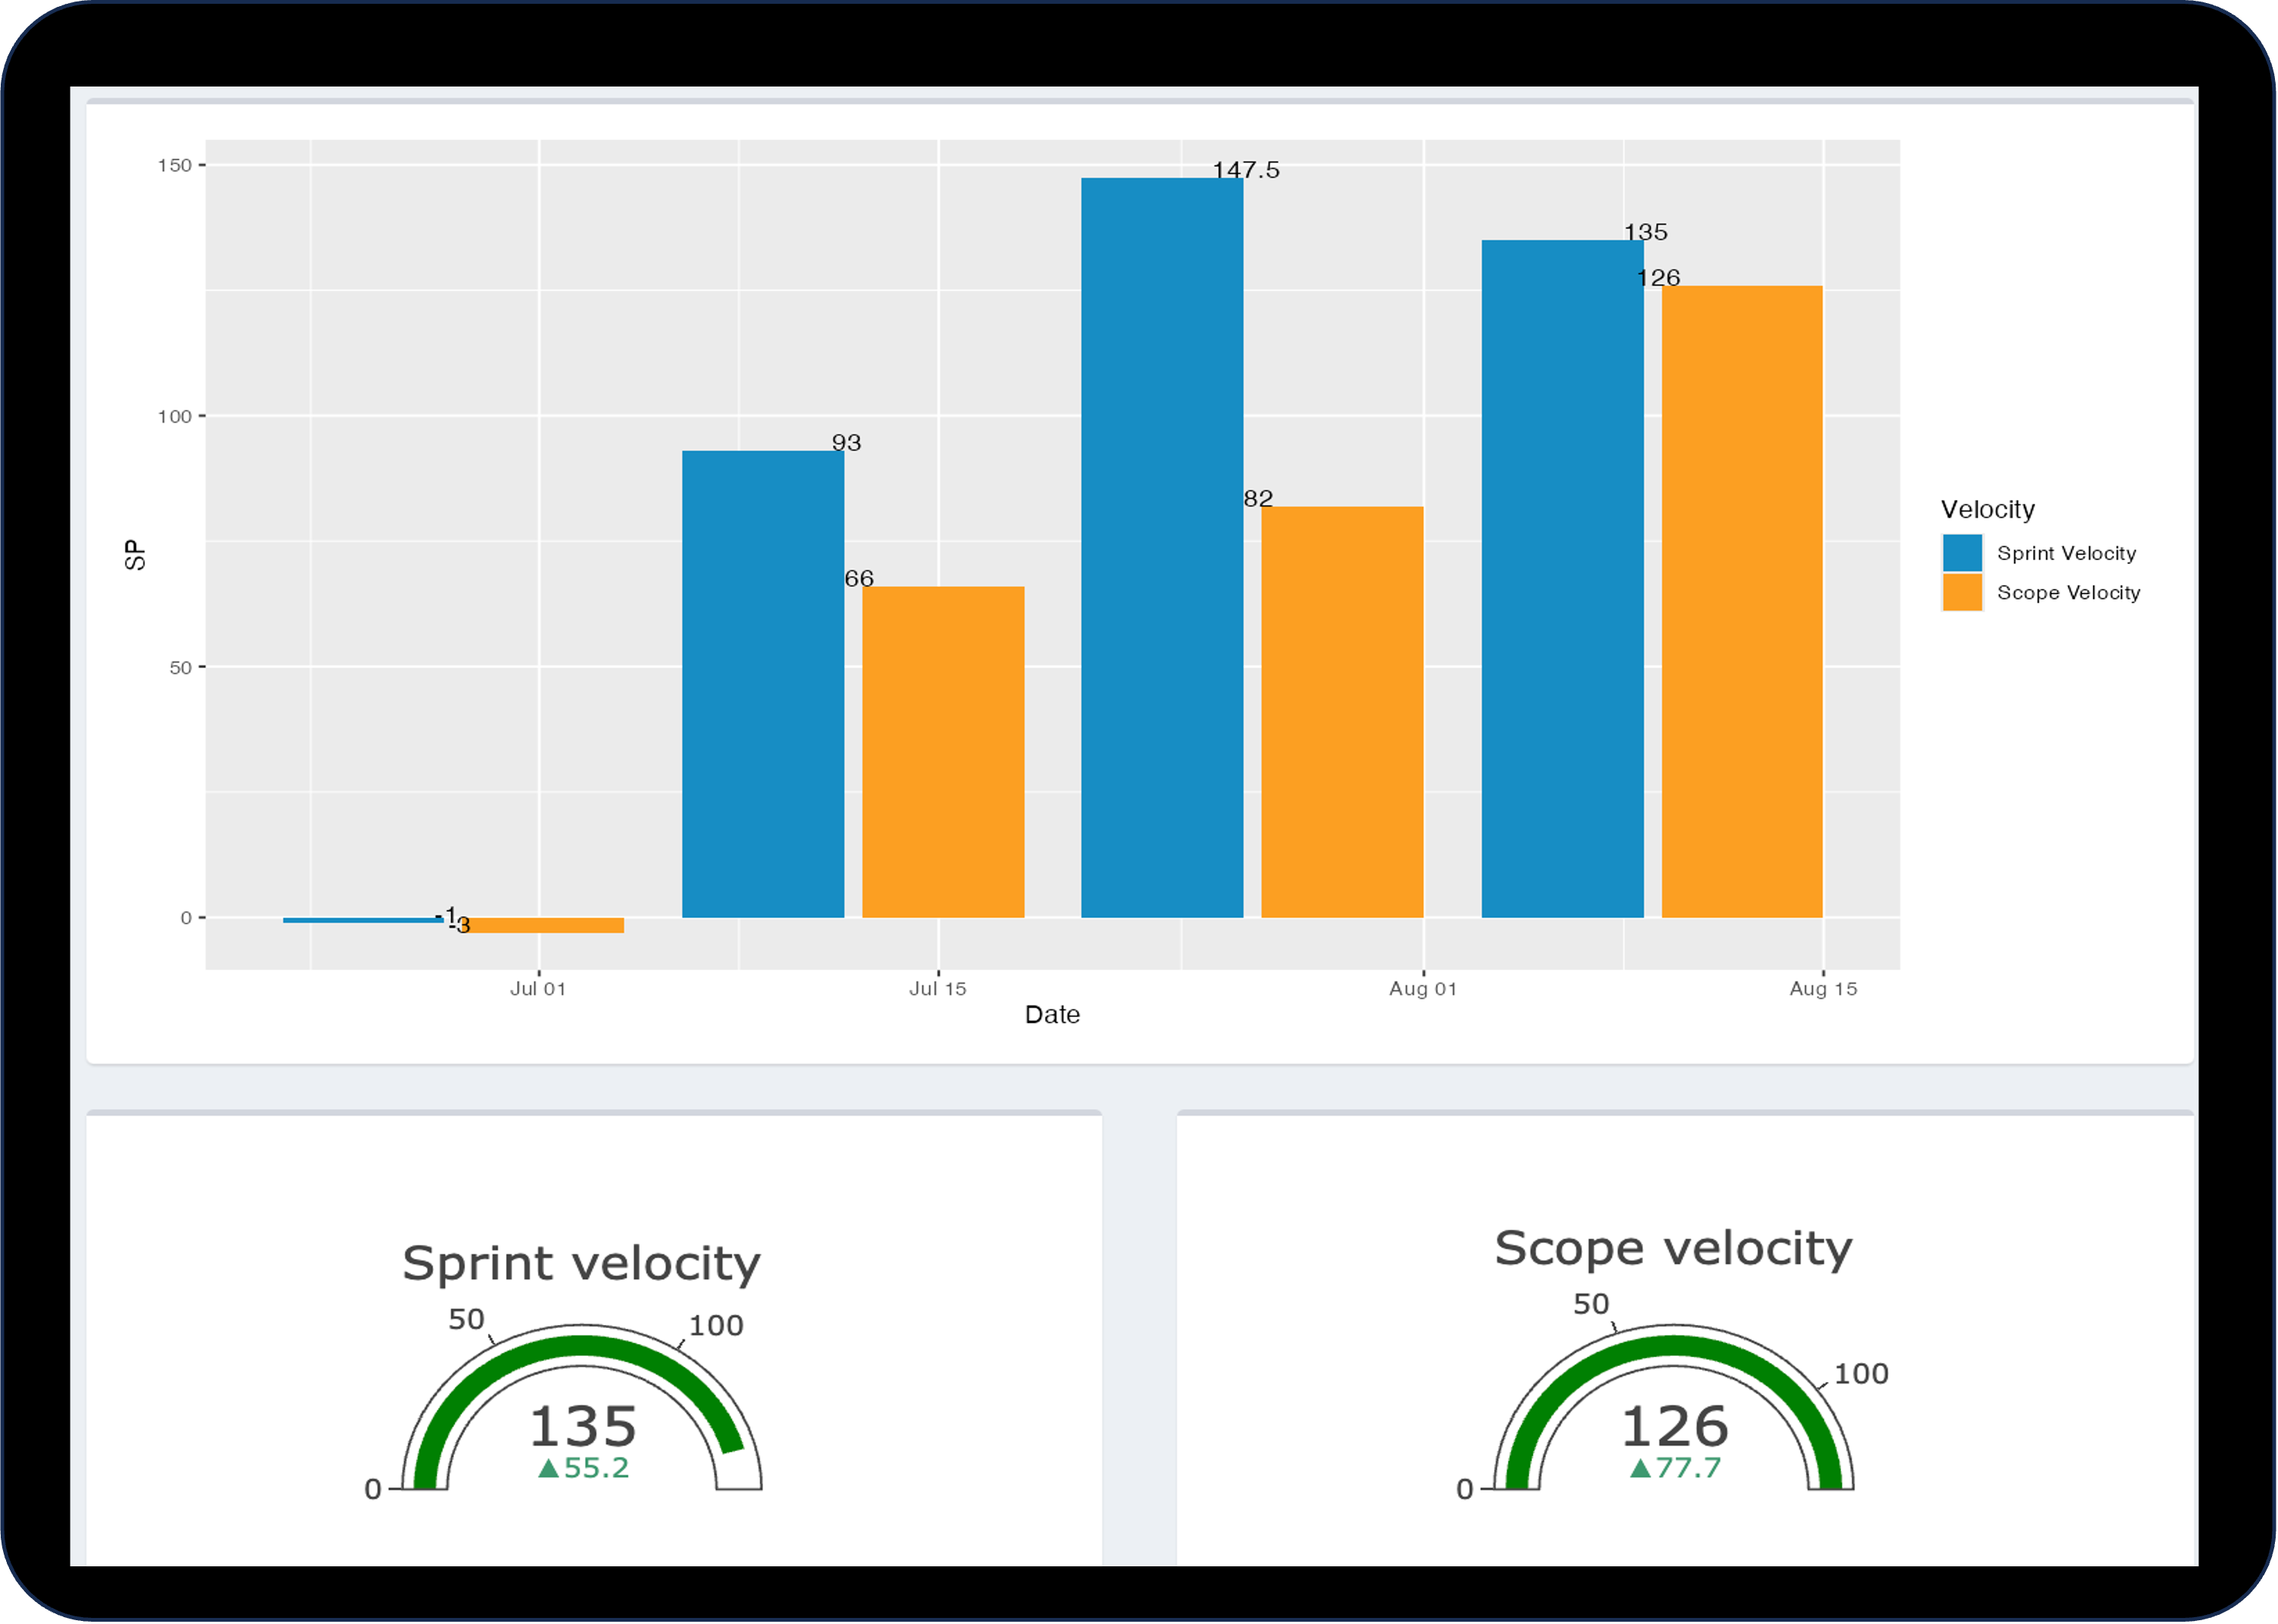
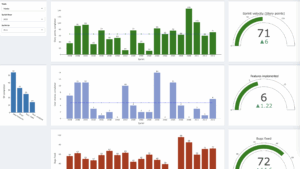
Teams velocity / Burn down - historical velocity charts: how fast teams deliver - are there any trends/patterns in delivery - velocity by work types: new features, bugs, maintenance, enablers, etc. - what is the ratio of work on scope/work on defects, operations/maintenance, waste? - trends, gauges (current velocity vs. average vs. maximum) - how many story points, features, bugs are delivered in certain period of time |
<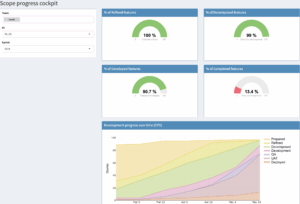 |
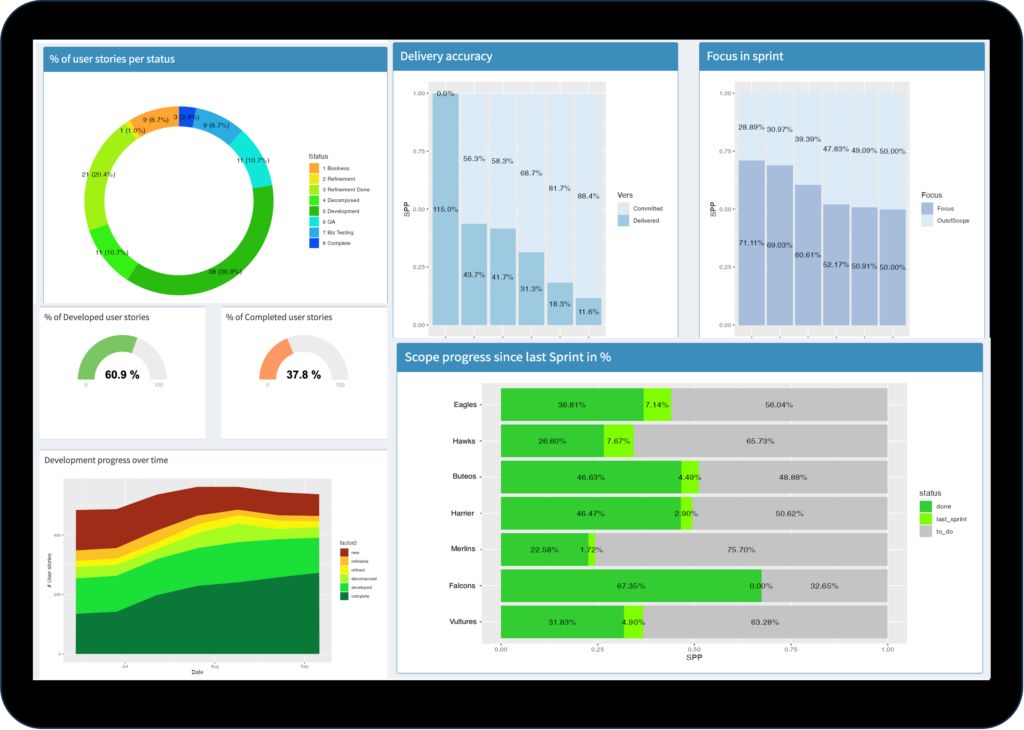
Cumulated flow diagram(CFD) and readiness by phase: - to which % are teams ready for the next stage charts - cumulated flow diagram (CFD) - overview of scope completion by status - status of the features in scope - what is the number of added/outscoped features in release/increment (spill-overs) - what is the distribution of my features across workflow stages |
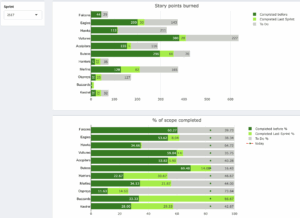 |
Progress vs. time - visualization of scope progress across agile teams sprint by sprint - how fast are teams progressing on the increment scope - which teams are not on track and how far - which teams perform better / more efficient - how much scope has been completed vs. how much should have been completed by this time - what is the progress on features/epics/user stories (sprint by sprint) - what is the progress on iteration / release scope (sprint by sprint) |
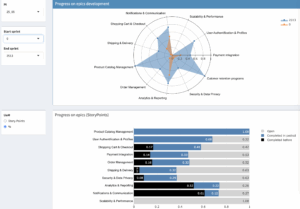 |
Agile compass shows direction: - progress by every prioritized epic/theme - which direction has advanced more in the last period - how much has to be done in each direction - do teams deliver what they commit, what is their predictability / sprint success ratio (committed vs. delivered) - what is the progress on iteration / release scope (sprint by sprint)? |
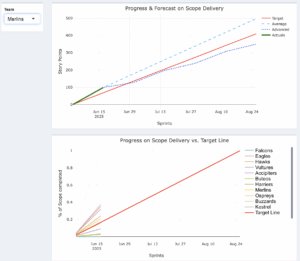 |
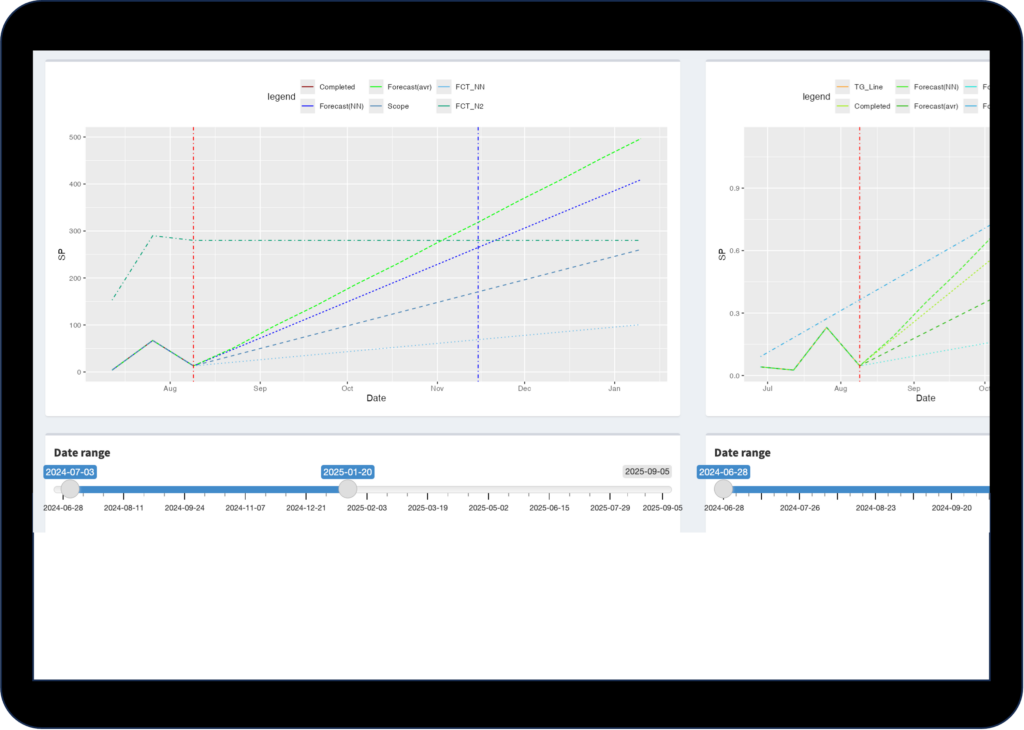
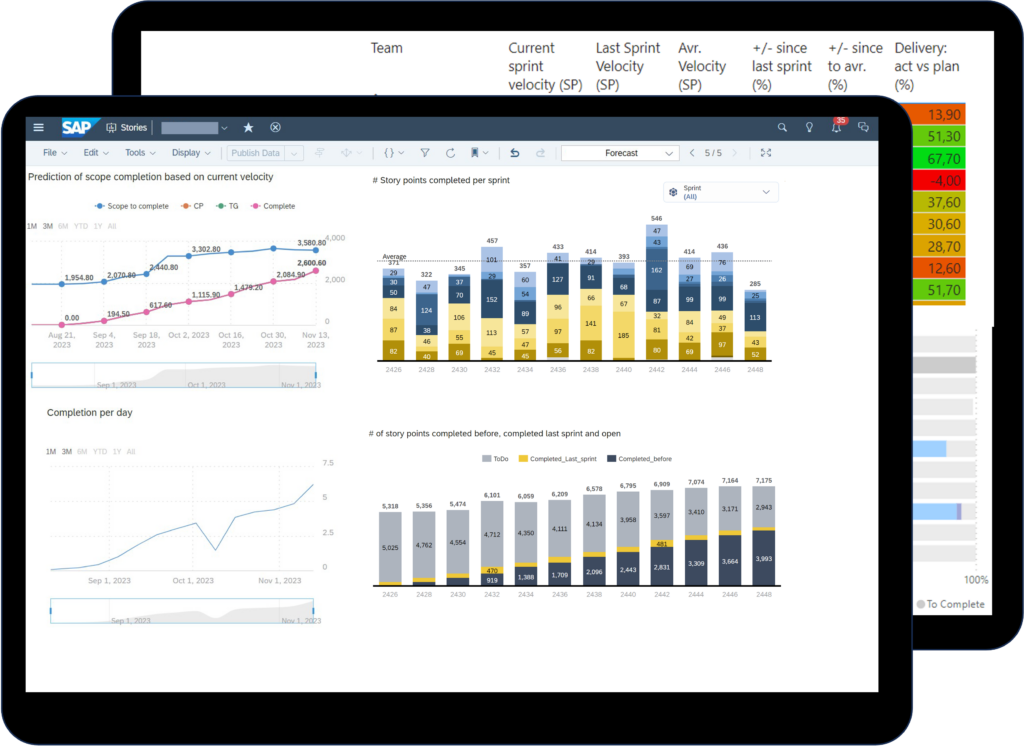
ML-based delivery forecasting - tracking of scope delivery - forecasting current delivery for every team - will the scope delivered in time - which part of scope is on risk to be not delivered - how much time in addition is needed for scope completion - multiple forecasting models are trained - what is the forecast on iteration scope delivery given the average and forecasted velocity |
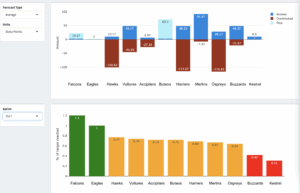 |
Data driven capacity planning - automatic capacity forecast (ML-models) - workload and scope simulations (for story points, capacity, sprints needed, etc.) - which teams are overloaded with scope and which still have capacity - how many sprints needed to complete the scope - what amount of work teams will be capable to deliver in the next iteration? - what is team capacity for the next sprint/iteration? |